Introduction
For intermediate traders seeking to improve their technical analysis, navigating price action without volume is difficult. To gain a complete picture, you must master two highly complementary volume indicators: Volume Weighted Average Price (VWAP) and Volume Profile.
VWAP calculates the true average price of an asset by combining both price and trading volume into a single, dynamic line. Big banks and institutional traders use VWAP as an essential, institutional-grade benchmark to determine the true average price. Volume Profile, conversely, plots traded volume horizontally at specific price levels rather than vertically. This creates a histogram revealing high-liquidity zones, known as High Volume Nodes (HVNs), and areas of low interest, or Low Volume Nodes (LVNs). By defining both value and historical interest, these tools map out market participation.
Core Mechanics
Understanding the mechanics of VWAP and Volume Profile reveals why they are incredibly powerful when paired. While VWAP shows you the intraday trend and where the market’s current average value lies, Volume Profile shows you where significant buying and selling has historically occurred at specific price levels.
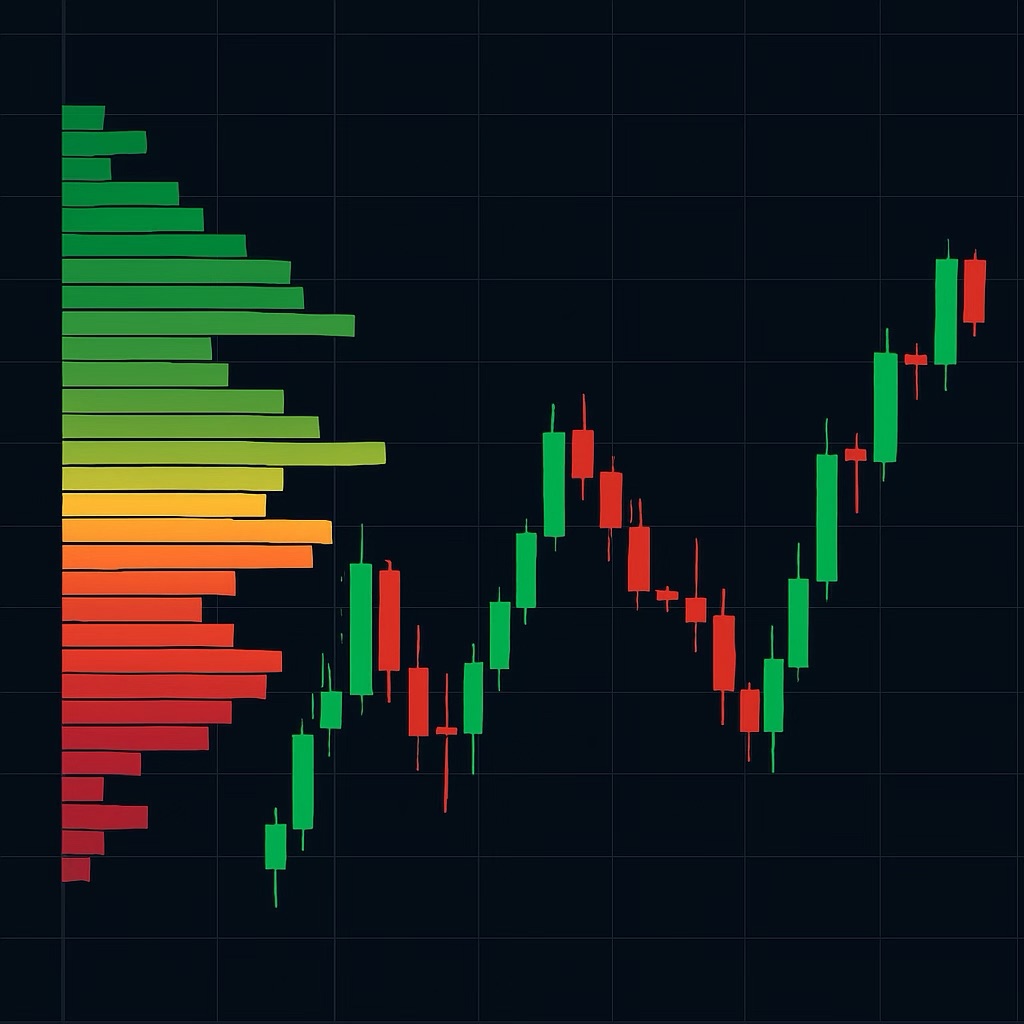
[IMAGE: A 5-minute candlestick chart showing a stock price reacting to the VWAP line within a High Volume Node of the Volume Profile]
When these concepts align, traders can identify areas of extreme confluence. If a stock’s price pulls back to the VWAP line—a level where institutions often look to move massive amounts of capital—and this line sits inside a High Volume Node (HVN), the likelihood of a strong reaction increases significantly. The HVN indicates that large amounts of liquidity reside at that price, while the VWAP confirms it is an acceptable average price for institutional accumulation.
Conversely, Low Volume Nodes (LVNs) represent price levels where little trading has taken place. These areas often act as price vacuums. If the price breaks through an HVN and crosses the VWAP dynamically, it will often move swiftly through an LVN until it finds the next zone of high liquidity.
[IMAGE: A chart setup highlighting a price vacuum moving quickly through a Low Volume Node after breaking above the VWAP indicator]
By using Volume Profile to map the terrain (identifying support, resistance, and liquidity zones) and VWAP to gauge the intraday trend, traders can filter out the noise. VWAP shows exactly who is in control of the market, while Volume Profile highlights where controlling players are most likely to execute. This synergy removes guesswork, providing an analytical framework for identifying high-probability zones.
Practical Application
Here is a systematic approach to integrating these tools into your trading plan:
- Define the Value Area: Before the market opens, check your Volume Profile to identify the Value Area (the price range where the majority of volume has traded) and mark the major High Volume Nodes (HVNs).
- Determine the Trend with VWAP: Institutions patiently accumulate positions when the price dips below the VWAP and distribute when it rises above. You can use this single, dynamic line to reveal the true trend and show exactly who is in control of the market.
- Look for Confluence Zones: Wait for the price to approach a level where a significant Volume Profile node aligns directly with the dynamic VWAP line.
[IMAGE: A trading chart displaying the Point of Control overlapping perfectly with the intraday VWAP line, acting as strong support] - Execute at Liquidity: When the price tests this confluence zone, look for candlestick confirmation to enter the trade, placing stop-losses just outside the established liquidity zone.
Conclusion
Mastering technical analysis is not about cluttering your screen with endless lagging indicators; it is about finding clarity. By combining the institutional footprint of the VWAP with the structural roadmap of the Volume Profile, intermediate traders gain a profound understanding of market mechanics. This synergy allows you to identify critical liquidity zones, understand institutional interest, and make highly calculated, objective decisions. Embrace this approach to elevate your analytical precision.
Leave a Reply