
Lesson 2 of 5 · The VWAP Wave System, explained
In Lesson 1 we put one line on the chart and called it value. That line has a limitation I ran into the first week I tried to trade it alone: it tells you where value is, but not how far from value is too far. Is price a little above average or dangerously stretched? VWAP alone can’t say. Deviation bands can, and they’re where the VWAP Wave System earns its name.
What the bands are
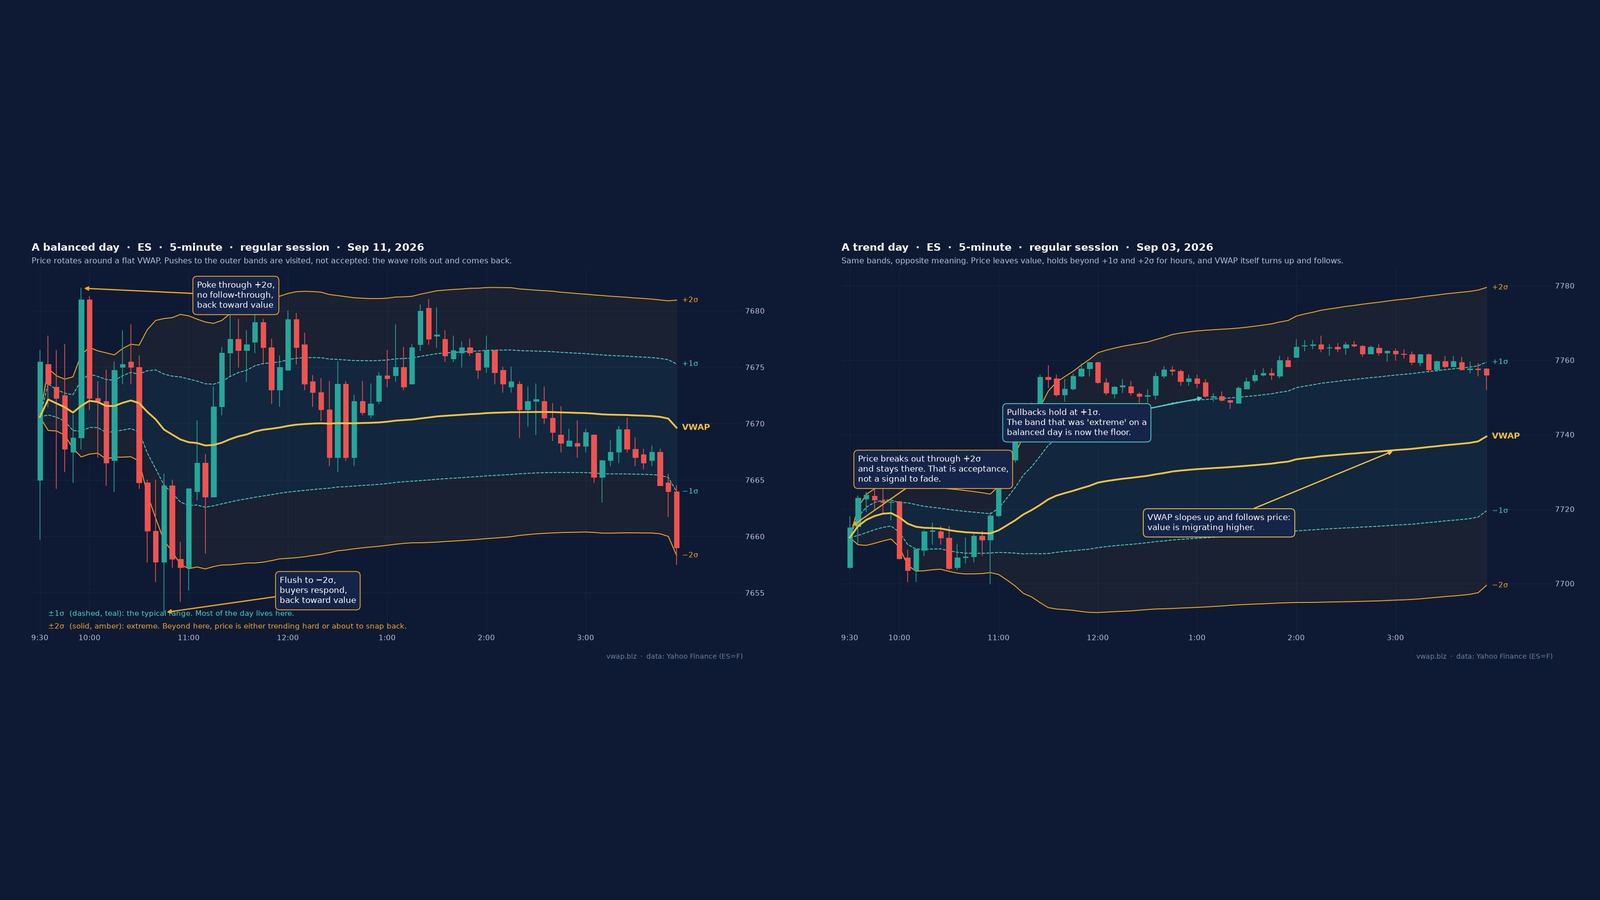
The bands sit above and below VWAP at statistical distances, standard deviations of the day’s price action. If that sounds like a maths class, here’s the version I give my small group. Take every trade of the day and measure how far it happened from VWAP. The first band, plus and minus one sigma, marks the range where most of the day’s business has been done. The second band, plus and minus two sigma, marks the edges: roughly ninety-five percent of a normal day lives inside it.
Picture the day’s price action as a wave rolling around a shoreline, and VWAP as the shoreline. The one-sigma bands tell you the wave is at normal height. The two-sigma bands tell you it’s cresting. That’s the picture Chris uses, and after a year of staring at these charts I haven’t found a better one.

The line I’d tape to a beginner’s monitor
Moves beyond the second band are either strong trends or imminent reversals. There’s no in-between. That’s the sentence from the system that took me longest to believe and now saves me the most money.
When price stretches past two sigma you’re looking at one of two things. Either it’s a genuine directional move with institutional money behind it, or it’s an exhausted push about to snap back to value. The bands do not tell you which. What they tell you is that you’re at a decision point, not in no-man’s-land, and that the next thing you do should be deliberate.
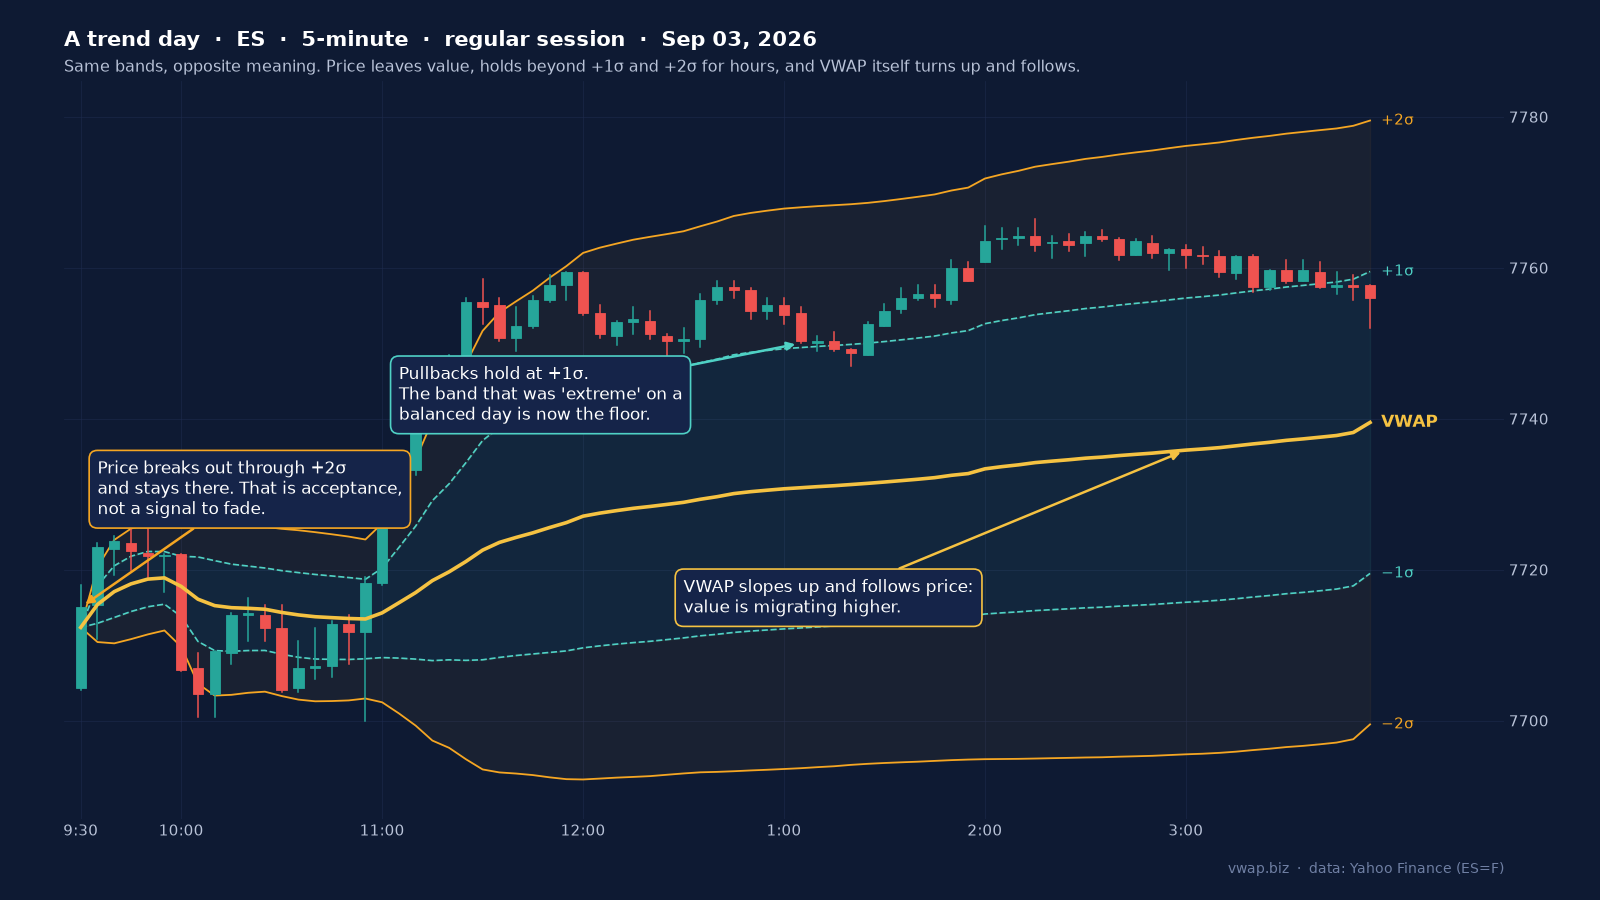
Put those two charts side by side and you have the whole lesson. Same instrument, same bands, same week. On the balanced day the outer band is a place to fade. On the trend day the same band is the floor that pullbacks bounce from. The band didn’t change. The day did.
Why this beats the overbought indicators I used to trust
I leaned on RSI and stochastics for years to judge stretch. The problem is that they’re built from price alone, and they say overbought at exactly the moment a trend day is getting started. VWAP bands are built from price and volume together, so they measure stretch relative to where real money actually transacted today. They’re a statistical description of this session, not a generic oscillator borrowed from a textbook.
One caution, and the system is insistent about it: the bands are statistical descriptions, not support and resistance. Price doesn’t bounce off a band because the band is there. It reacts because of what the band represents, and confirming that takes context. That’s Lessons 3 and 4.
What’s next
Now you have the map: a value anchor and bands that measure how stretched price is. The next question is the one that matters most, and the one I got wrong the longest: what do you actually trade?
Next lesson, Lesson 3: The four core setups of the VWAP Wave System.
The band mathematics, the chart settings, and the TradingView configuration are Chris’s material, not mine: they’re in the book and drawn for you by the VWAP Wave System Toolkit.
Disclosure. VWAP.biz is an independent site written by Scott West, a paying member of Drysdale Trading Group. The VWAP Wave System™ is Chris Drysdale’s work, and this site is not affiliated with or endorsed by him. Links to his book, toolkit, and community are affiliate links: if you buy through them I may earn a commission at no extra cost to you. Nothing here is financial advice, and trading futures carries a risk of loss. Full disclosure · Risk disclaimer
Ready for the system itself, not just my lessons on it?
I explain the VWAP Wave System from a student’s chair. Chris Drysdale teaches it. Start with his free Core Setup Guide, read the book, or take seven days inside Drysdale Trading Group and watch it traded live.