
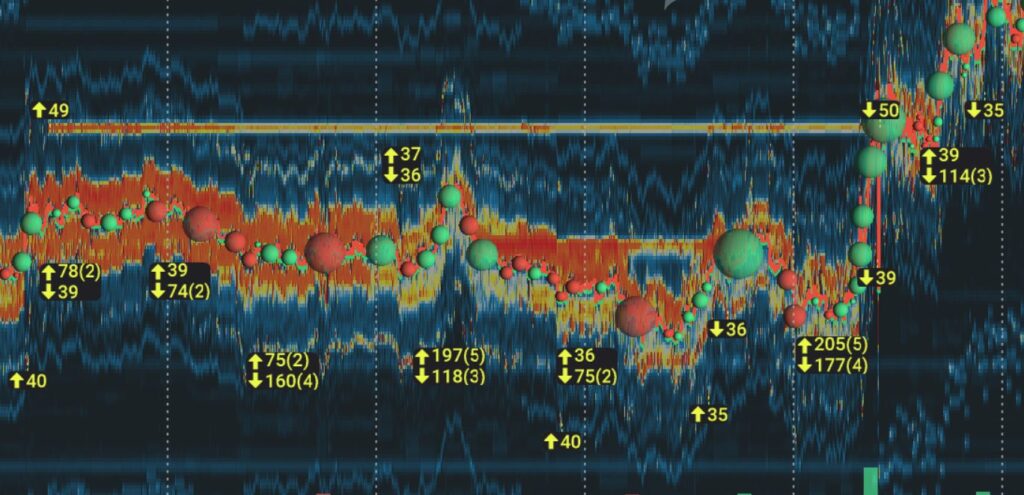
The Bookmap Liquidity Marker is an add-on that puts arrows on the heatmap where a large block of resting liquidity was added, pulled or moved within 5 seconds, with the size. A second mode marks where the largest liquidity is sitting right now.
Yellow arrows mark a large block of limit orders added to a level, or pulled from it. Size added at my level is a wall being built. Size pulled just before price arrives is the trap.
Which plan: free on every tier, including the free Digital tier.
$147 for your first quarter or $588 for the first year (then $297 a quarter or $948 a year), 14-day money back on this offer. Prices checked 7 November 2026. All plans and prices. The free tier is a look at the software, not live futures.
Affiliate link. Bookmap pays me a commission if you subscribe; it costs you nothing extra, and I was paying full price for years before the link existed.
What does the Liquidity Marker draw?
Two modes. Liquidity Markers: an arrow wherever the size at one price changed by more than your threshold within 5 seconds. Max Liquidity Levels: where the largest resting size is, limited to as many markers as you want.
Overlapping markers merge: 112/3 means a change of 112 from three separate changes. Zoom in and they split apart again.
How I read the Liquidity Marker
It catches what my eyes miss on a busy heatmap: the 200 lots that appear two ticks under my entry, or the ones that vanish right before price gets there. The heatmap shows that too, if you happen to be looking at that pixel at that second. I usually am not.
In my own layout it’s number 4, the yellow arrows marked 52 and 59.
Added size isn’t support by itself. Size can be shown to be seen and pulled before it trades. What matters is what happens when price arrives, which is why I keep watching after the arrow.
Settings worth knowing
- Display threshold: the minimum change in 5 seconds. Auto calculate sets it from the number of markers you want.
- Number of markers: show only the N biggest changes, so a fast market doesn’t bury the chart.
- Filter markers near BBO: hide the levels next to the best bid and offer, where high-frequency traders do most of their fidgeting.
- Increasing, decreasing or both: pick which changes to show.
Bookmap’s own Liquidity Marker guide has the rest, with pictures.
My screen and settings
Screenshot of my own layout and the settings I run are on the way; until then, Bookmap’s picture above is the honest version.
Questions people ask
Is the Bookmap Liquidity Marker free?
Yes. It’s included on every tier, including the free Digital tier.
Why is my chart covered in arrows?
The threshold is too low for the instrument. Use Auto calculate, cap the number of markers, and filter the levels next to the best bid and offer.
Does added liquidity mean support?
Not by itself. Orders can be added to be seen and pulled before they trade. Watch what happens when price arrives.
Next: Orderbook Imbalance · Back to the Bookmap Library · Which Bookmap plan?
Offer and prices as above, checked 7 November 2026. All plans and prices
Disclosure. VWAP.biz is an independent site written by Scott West, a paying member of Drysdale Trading Group™. The VWAP Wave System™ is Chris Drysdale’s work. He doesn’t own or run this site, but he has reviewed and endorsed it. Links to his book, toolkit, and community are affiliate links: if you buy through them I may earn a commission at no extra cost to you. As an Amazon Associate I earn from qualifying purchases. Nothing here is financial advice, and trading futures carries a risk of loss. Full disclosure · Risk disclaimer