
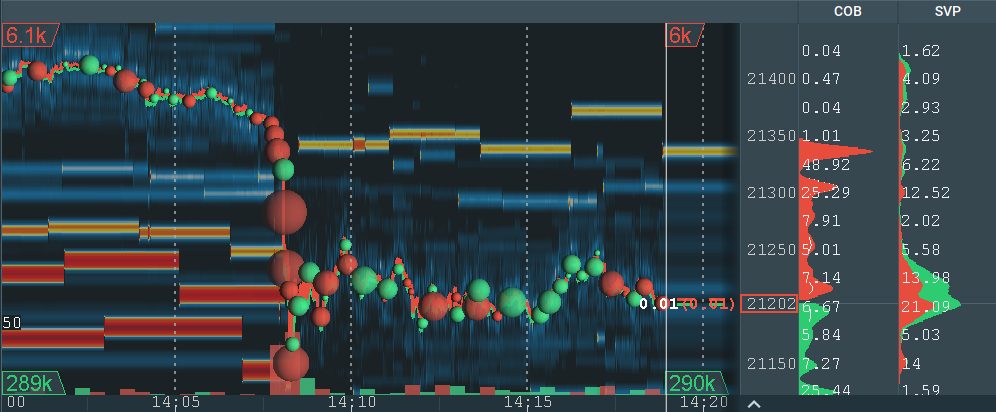
Bookmap Outside Liquidity is an add-on that shows how much bid and ask liquidity sits above and below the part of the heatmap on your screen, as numbers in the chart’s corners. You can show the totals, the difference between bids and asks, or both.
In my layout the 5s mark the thick walls above and below the range: my targets when I’m in, my traps when price rotates toward them with no aggression behind it. The numbers in the corners (8k, 7.6k, 7.7k with its Δ337) are this add-on, telling me how much more is waiting past the edge of the screen.
Which plan: included from Global.
$147 for your first quarter or $588 for the first year (then $297 a quarter or $948 a year), 14-day money back on this offer. Prices checked 7 November 2026. All plans and prices. The free tier is a look at the software, not live futures.
Affiliate link. Bookmap pays me a commission if you subscribe; it costs you nothing extra, and I was paying full price for years before the link existed.
What does the Outside Liquidity indicator draw?
Numbers in the four corners of the heatmap. The left corners show the liquidity at the time on the left edge of the chart; the right corners show it now. Top is the asks above the screen, bottom is the bids below it.
Three modes: the totals, the difference between bids and asks (green when bids are bigger, red when asks are), or both at once. You choose how many levels beyond the screen count, and whether far levels count for less.
How I read outside liquidity
The walls beyond the screen are where a move is likely to stall. When I’m in a trade, they’re my targets. When price is rotating toward one with no aggression behind it, it’s a trap, and I’d rather watch it than join it.
Comparing the left and right corners is the quick read. If the bids under the screen have grown a lot since the left edge, someone has been building a floor while I was zoomed in on the action.
It also stops me zooming out every two minutes, which is good for my charts and my neck.
Settings worth knowing
- Indicator mode: totals, difference, or both. I run both.
- Limit the number of levels: count only the first N levels beyond the screen, so a wall 200 ticks away doesn’t drown the one 12 ticks away.
- Include visible price levels: start counting from the best bid and offer instead of the screen edge.
- Lower weight for further levels: a half-life in price levels, so distant size counts for less.
Bookmap’s own Outside Liquidity guide has the rest, with pictures.
My screen and settings
Screenshot of my own layout and the settings I run are on the way; until then, Bookmap’s picture above is the honest version.
Questions people ask
Which Bookmap plan includes Outside Liquidity?
Global and up: Global, Global Plus and Global Premium.
Does it show where the orders are?
No, only how much. The heatmap shows where once you scroll; this tells you whether it’s worth scrolling.
Why are the left and right numbers different?
The left corners are the liquidity at the start of the visible time; the right corners are now. The gap between them is the story.
Next: Stops and Icebergs · Back to the Bookmap Library · Which Bookmap plan?
Offer and prices as above, checked 7 November 2026. All plans and prices
Disclosure. VWAP.biz is an independent site written by Scott West, a paying member of Drysdale Trading Group™. The VWAP Wave System™ is Chris Drysdale’s work. He doesn’t own or run this site, but he has reviewed and endorsed it. Links to his book, toolkit, and community are affiliate links: if you buy through them I may earn a commission at no extra cost to you. As an Amazon Associate I earn from qualifying purchases. Nothing here is financial advice, and trading futures carries a risk of loss. Full disclosure · Risk disclaimer